
How can you reduce your impact???
Education, awareness and enjoyment is what will help protect our natural environment. As we enjoy, we can connect, escape and understand the true priceless value of mother nature. The common feeling humans share is the vast wonder of the natural world and all that lives on this earth. Watching the sunrise or set is shared by everyone, and so is conservation of the natural world. We all need to play our part.
When we enjoy the natural world as a tourist or daily visitor to our favourite local spot, we always need to think about our impact. We need to minimise our impact when we have fun, to not cause harm to the environment or reduce enjoyment of others. Here are some suggestions on ways to minimise your impact.
The 7 Leave No Trace Principal
- Plan ahead and prepare
- Travel and camp or durable surfaces
- Dispose of waste properly
- Leave what you find
- Minmise campfire impacts
- Respect wildlife
- Be considerate of other visitors
What else can you do?
- Catch public transport or car pool
- Watch or ride a bike
- Report bad behaviour
- Carbon offset your travel
- Don’t buy single use plastics
- Pack reusable items, drink bottle ect
- Pick up rubbish safely when you see it
- Join community clean up groups
Climate Change – What does the data say on BOM site??
According the BOM The latest State of the Climate report (along with the previous reports) can be accessed at csiro.au and at bom.gov.au . The information presented here is based on the 2020 release of the State of the Climate report.
Australia is already experiencing the impacts of climate change:
Australia’s climate has warmed by about 1.4 °C since 1910, leading to an increase in the frequency of extreme heat events.
Warming has occurred across Australia in all months, with both day and night-time temperatures increasing.
This long term warming trend means that most years are now warmer than almost any observed during the 20th century.
Australia’s warmest year on record was 2019, and the seven years from 2013 to 2019 all rank among the nine warmest years.
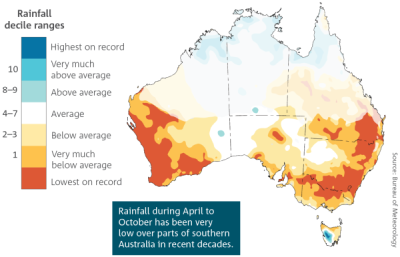
April to October rainfall deciles for the last 20 years (2000–19). A decile map shows where rainfall is above average, average or below average for the recent period, in comparison with the entire rainfall record from 1900. Areas across northern and central Australia that receive less than 40 per cent of their annual rainfall during April to October are faded.
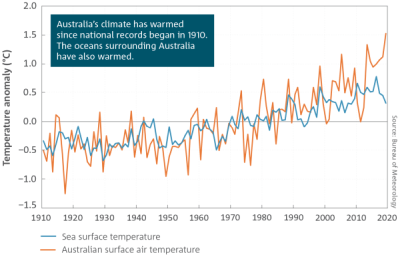
Anomalies in annual mean sea surface temperature, and temperature over land, in the Australian region. Anomalies are the departures from the 1961–1990 standard averaging period. Sea surface temperature values (data source: ERSST v5, www.esrl.noaa.gov/psd/) are provided for a region around Australia (4–46 °S and 94–174 °E).
- Despite the large natural year-to-year variability in Australian rainfall, underlying long-term trends are evident in some regions. For example:
- The southwest and southeast of Australia have experienced drier conditions, with more frequent years of below average rainfall, especially for the cool season months of April to October.
- Cool season rainfall has been above average in western Tasmania during recent decades.
- Northern Australia has been wetter across all seasons, but especially in the northwest during the northern wet season (October to April). However, rainfall variability remains high.
- There has been an increase in the intensity of heavy rainfall events in Australia. The intensity of short-duration (hourly) extreme rainfall events have increased by around 10 per cent or more in some regions over recent decades.
- There has been an increase in extreme fire weather and in the length of the fire season across large parts of Australia since the 1950s, especially in southern Australia.
- Sea surface temperatures around Australia have warmed by over 1 °C since 1900. Warming of the ocean has contributed to longer and more frequent marine heatwaves.
- Global average sea level has risen by around 25 cm since 1880. Rates of sea level rise vary across the Australian region, with the largest increases to the north and southeast of the Australian continent.
- A downward trend in maximum snow depth has been observed for Australian alpine regions since the late 1950s, with large year-to-year variability. Downward trends in the area covered by snow, length of time that cover persists and the number of snowfall days in Australia have also been observed.
- There has been a decrease in the number of tropical cyclones observed in the Australian region since 1982.
Australia’s climate is projected to continue to change over the coming decades. The following changes are projected:
- Australia is projected to continue to get hotter into the future, with more extremely hot days and fewer extremely cool days.
- Capital cities across Australia can expect a substantial increase in the number of very hot days .
- Past climate change and projections of Australia’s average temperature show that 2019 (Australia’s hottest year on record) is expected to be an average year in a world where the global mean temperature is 1.5 °C above the pre-industrial baseline.
- A longer fire season for the south and east and an increase in the number of days experiencing dangerous fire weather is projected.
- Australia is projected to experience a decrease in cool season rainfall across many regions of the south and east, likely leading to more time spent in drought.
- As the climate warms, heavy rainfall is expected to become more intense throughout Australia.
- Average Australian sea levels are projected to continue to rise into the future, with regional differences.
- As the oceans continue to warm, more frequent, intense and long-lasting marine heatwaves are projected, leading to increased risk of more frequent and severe coral bleaching events.
- Fewer east coast lows are projected, particularly during the cooler months of the year. For events that do occur, sea level rise will increase the severity of some coastal impacts.
- Fewer tropical cyclones are projected, but a greater proportion of those that do occur are projected to be of high intensity, with ongoing large variations from year to year.
- In Alpine regions, an increase in snowmelt, especially at low latitudes, is projected along with a decline in snowfall.
Further reading and resources:
- State of the Climate report
- Bureau of Meteorology: Climate change – trends and extremes
- Earth Systems and Climate Change Hub
- IPCC Fifth Assessment Report, The Physical Science Basis